
Graphing Plugins
Graphing plugins provide the main visual data exploration method for the user. All graphs/plots are fundamentally provided by the external library matplotlib so developers should familiarize themselves with the functionality it provides.
The functionality of graphing plugins is divided into two parts, similar to the clustering plugins:
- Options dialog
- Graphing method
Both parts are required, and must be returned by the registration
function that must be included in the __all__ variable. For
graphing plugins, FIND expects the registration method to return
a 3-tuple containing the graphing method, the options dialog class,
and a list containing the data item types the plugin applies to.
Currently there are two data items: datasets and clusterings,
represented by 0 and 1 respectively. For example,
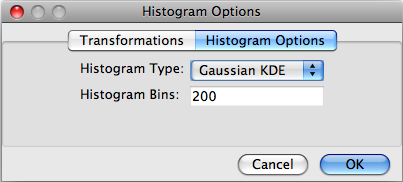
the histogram_register method of the Histogram
plugin is:
def histogram_register():
   return (histogram, HistogramOptionsDialog, [0])
Note
Only the method/class reference is passed, so () are omitted.
Here the third item of the tuple is a list containing one entry: 0.
This indicates that Histogram plots are only applicable to datasets and
not clusterings. For a graphing method that applies to both (like the
built-in 2D Scatterplot) the list would be [0,1].
Options Dialog
The options dialog provides a graphical interface for users to alter the output of the graphing plugin.
The FIND API provides a useful base class for creating options dialogs for graphing methods: OptionsDialog. This class subclasses wx.Dialog, and provides a wx.Notebook control that gives the tabs seen in the figure above. The class is available by the following import statement:
from plot.base import OptionsDialog
The base OptionsDialog class provides, in addition to the tabs, a built-in validation routine and template, as well as a template for loading and providing the options associated with the overall dialog:
class OptionsDialog(wx.Dialog):
   def __init__(self, parent, subplot, title="Plot Options", size=(200,180)):
      wx.Dialog.__init__(self, parent, wx.ID_ANY, title, size=size)
      self.CenterOnParent()

      self.NB = wx.Notebook(self)

      # sizer for layout
      sizer = wx.BoxSizer(wx.VERTICAL)
      sizer.Add(self.NB, 1, wx.EXPAND)
      self.SetSizer(sizer)


   def cmdOK_Click(self,event):
      """
      Generic handler method for capturing the OK button click. This method
      will run the validate method for each panel in the Notebook and collect
      any error messages. If errors exist, a message dialog will be shown
      and the options dialog will be prevented from confirming until the
      errors are fixed. Otherwise, the event will be bubbled up as normal.
      """
      msg = []
      for i in range(self.NB.PageCount):
         msg.extend(self.NB.GetPage(i).validate())

      # Display any error messages
      if len(msg) > 0:
          dlg = wx.MessageDialog(None, '\n'.join(msg),
                                'Invalid input', wx.OK | wx.ICON_ERROR)
          dlg.ShowModal()
          dlg.Destroy()
          return

      event.Skip()

   def loadOptions(self, opts):
      """
      Loads saved options into all notebook pages via the loadOptions()
      method that must exist in each.

      Unless specific functionality is needed, subclasses of OptionsDialog
      should not need to override this method.

      :@type opts: dict
      :@param opts: The saved plot options.
      """
      for i in range(self.NB.PageCount):
         self.NB.GetPage(i).loadOptions(opts)

   @property
   def Options(self):
      """
      The Options property will retrieve all settings from each notebook page in self.NB

      Unless specific functionality is needed, subclasses of OptionsDialog
      should not need to override this property.

      :@rtype: dict
      :@return: The specified plot options.
      """
      options = {}
      for i in range(self.NB.PageCount):
         options.update(self.NB.GetPage(i).Options)

      return options
In this class, the loadOptions method and the Options property
are run automatically and do not need to be overridden by subclasses.
The cmdOK_Click method is available for automatic validation, if
desired. However, if you want to include custom code in the click
event method for the OK button on the Dialog, you must implement
your own. However, you can still make use of the validation code
by calling the cmdOK_Click from the superclass once your custom
event code is completed.
Separate groupings of options are placed in tabs, and some general sets of options are provided by the FIND API.
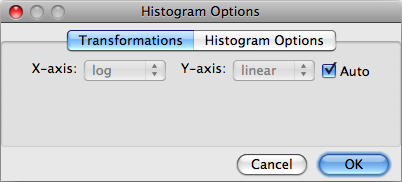
For example, the Transformations options (as seen in the figure above) can be accessed by the following import statement:
from plot.base import TransformOptionsPanel
Developers can provide their own option panels that can be included as
a tab in the dialog by subclassing from the OptionsPanel class, also
available in the plot.base module.:
class OptionsDialogPanel(wx.Panel):
   def loadOptions(self, opts):
      pass

   def validate(self):
      pass

   @property
   def Options(self):
      pass
Each of these methods must be overridden for each panel that subclasses
from OptionsDialogPanel. The loadOptions method simply takes
the opts dictionary and copies the panel-specific options from it
into the panel controls. The validate method builds a list of
strings containing error messages, one list item per validation error.
These lists are gathered from each options panel, concatenated, and
displayed to the user after clicking the OK button, and control is returned
to the user for them to correct the errors. If none of the panels report
errors, program execution continues to the graphing method. The Options
property is the opposite of the loadOptions method; it builds a dictionary
of option/value pairs from the controls on the panel. Each panel contributes
its own options dictionary to a larger one that is finally passed to the
graphing method for use.
The other built-in, generic options panels are:
RangeOptionsPanel, SingleTransformOptionsPanel
The RangeOptionsPanel allows users to specify range in the X and Y axes. The SingleTransformOptionsPanel is identical to the TransformOptionsPanel, except it provides a single transformation for the whole plot (instead of by axis). Below is a list of the options each of the previously mentioned options panels provides:
RangeOptionsPanel: 'xRange', 'yRange', 'xRangeAuto', 'yRangeAuto'
TransformOptionsPanel: 'xTransform', 'yTransform', 'transformAuto'
SingleTransformOptionsPanel: 'transform', 'transformAuto'
For the RangeOptionsPanel, xRange and yRange are tuples containing floats.
The other two options are booleans indicating whether the user wants the
respective range options chosen automatically by the graphing method. For
the TransformOptionsPanel, the x and y transform options are strings
indicating the type of transform method that should be applied to the data
before graphing. Currently the only available options are linear and log.
Linear amounts to not applying any transform to the data. The log transform
can be applied by the particular matplotlib plot (if available), or using the
FIND Transforms API, which will be discussed later in the section on Graphing
Methods.
Graphing Methods
The second part of any Graphing plugin is the actual graph/plotting method that causes the underlying matplotlib library to draw to the plot Panel in the FIND user interface. The expected method signature and doc string are as follows:
def graphingMethod(subplot, dims):
   """
   method-string-ID; method-name; Method description string
   """
The two parameters above are always passed to the graphing method, but do not
necessarily need to be each used. The dims parameter is simply a list
containing the currently selected data dimensions. The subplot parameter is
a Subplot class instance. This class is the basic unit that represents a
single graph/plot in the plot Panel in the UI. It contains the following
attributes (lower case) and properties (capitalized) of use to plugin authors:
Subplot:
   Data
   Clustering
   opts
   axes
   parent
The Data and Clustering properties, respectively, provide the data array
and (optionally) the array of cluster assignments. As stated previously,
graphing methods must specify whether they apply to datasets, clusterings, or
both. Thus, you only need to use what you specify as the target items. The
opts attribute is a dictionary collected from the options dialog provided
with the graphing method.
Important
Since the options dialog is only available to the user once the plot has been drawn, the
optsattribute is empty the first time the graphing method is called. Thus, each graphing plugin must check whether theoptsdict is empty and fill it with default options.
The axes attribute is an instance of the matplotlib
Axes class. This
class is the target for drawing, and all matplotlib provided plotting
methods are available through it. The final parent attribute is an
instance of the matplotlib
Figure class. This
class represents the entire drawing area in the UI, and is necessary for
some applications such as providing scale bars and legends on plots (see
the Heatmap2D plugin for an example).
As mentioned above, you may want to include data transformation options
in your plugin. Currently the built-in options panel is not linked to the
Transform methods module, and only allows for linear and log options.
However, if you want to perform a log transformation before plotting
(instead of asking matplotlib to do it as part of the plot), you can
access the Transforms module with the following import:
import transforms.methods as tm
This module provides a getMethod(strID) method that returns the method
specified by the string identifier of the transformation method/plugin.
So to apply a log transform to your data with the built-in log method
you might use the following line:
logData = tm.getMethod('log')(data)
The graphing method is not expected to return anything since the entire aim is to issue drawing commands to the underlying matplotlib engine.
Returning to the method declaration, the first line of the doc string must be semicolon-separated into three fields as seen above. The ‘string-ID’ field is what other plugin authors will give to the internal plot module in order to access the graphing method from within their own code. For example, an analysis plugin may want to display results in a temporary window that provides a simple Figure canvas. The ‘method-name’ is a short name that FIND will use for the menu item placed in Plugins>>Graph as well as the context plot menu that appears when clicking on a data item in the project tree. The final field will appear in the program status bar when a user moves the mouse over the menu item for the graphing plugin.